Webinars Blog
WBENC Social Media Presentation
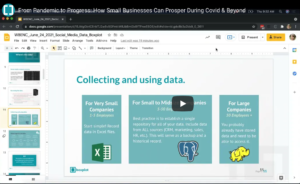
September 19th, 2021 by BoxplotWatch the Webinar View the text for the video In June 2021, Barb was a guest speaker for the WBENC webinar series: From Pandemic to Progress. This webinar is geared towards small business owners who want to analyze their company’s social media data to use it for their advantage. The webinar goes into detail from […]
Data Hour (September)
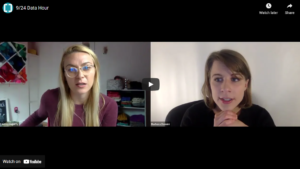
June 10th, 2021 by BoxplotWatch the Webinar Barb returns to PowerToFly as a guest speaker in the “Data Hour” webinar. The first half of this “Data Hour” webinar consists of answers that Barb has for some general and more specific data analysis-related questions that the audience has. Some of the audience questions in this webinar include: “What is the […]
Intro To SQL
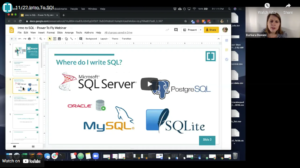
November 22nd, 2019 by BoxplotWatch the Webinar PowerToFly has Barb on as a guest speaker in the “Intro to SQL” webinar. In this webinar, Barb answers various questions regarding SQL including: “What is SQL?”, “What kind of jobs use SQL?” and “What is a SQL query and what do I need to make one?”, followed by more specific questions […]
Data Hour (July)
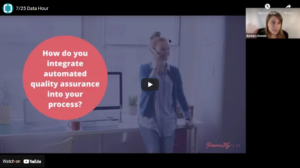
July 25th, 2019 by BoxplotBarb returns to PowerToFly as a guest speaker for another “Data Hour” webinar. This “Data Hour” webinar consists of answers that Barb has for some general and more specific data analysis-related questions that the audience has. In this webinar, Barb answers many questions about data visualisation such as some of her favorite tools for compiling […]
Data Chat
April 4th, 2019 by BoxplotBarb returns to PowerToFly as a guest speaker, this time, for a “Data Hour” webinar. This webinar consists of answers that Barb has for some general and more specific data analysis-related questions that the audience has. What’s unique about these Data Hour webinars is that audience members are able to get specific answers to questions […]
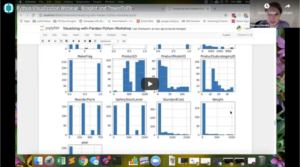
Data Visualization in Python Lunch + Learn
February 20th, 2019 by BoxplotData analytics expert, Barbara Donnini, joins PowerToFly as a guest speaker for a Python Visualization Seminar. This interactive seminar combines Python, Jupyter, and Pandas and focuses on visualizing and plotting. Some tasks that audience members learn throughout the course of this webinar include: importing and loading data and coding line plots, bar plots, histograms, scatter […]