A/B Testing Example (Two Proportion Hypothesis Test)
A/B Testing Example (Two Proportion Hypothesis Test)
by Boxplot Sep 25, 2019
A/B testing (sometimes called split testing) is comparing two versions of a web page, email newsletter, or some other digital content to see which one performs better. A company will compare two web pages by showing the two variants (let’s call them A and B) to similar visitors at the same time. Typically, the company is trying to see which page leads to more sales, so the one that gives a better conversion rate wins.
You work for a nonprofit and your organization has two different webpages designed to solicit donations, we’ll call them page A and page B. The two pages are trying to accomplish the same result – to get the viewer of the page to donate, but they both have different looks and feels from one another. The success of these web pages is measured by the percentage of people who wind up making a donation (in any amount). For example, if 100 people view page A and 10 purchase, A’s conversion rate is 10%.
The nonprofit wants to test if one page is doing statistically significantly better than the other (that is, leading to more donations) and has tasked you with coming up with an answer.
Step 1: Collect Data
The first thing you need to do is choose a period of time. Let’s say one month. Then, collect your data. In one month, page A had 100,000 views and 20,000 people made a donation. In that same month, Page B had 80,000 views and 15,000 people purchased a product.
- The proportion for success for Page A is pA = 20,000/100,000 = .2 = 20%
- The proportion for success for Page B is pB = 15,000/80,000 = .1875 = 18.75%
- The difference between these two proportions is .2 – .1875 = .0125 = 1.25 percentage points
Step 2: Choose a Test
To determine if the conversion rate for page A is significantly higher than page B, we do a difference of proportions test. Choosing a test sometimes can be the most difficult part of a statistical analysis! Different test statistics (T, Z, F, etc.) are used for different types of data. Use the Statistics Cheat Sheet for Dummies chart or other related sites like StatTrek to help you choose the right test based on your sample.
Step 3: Pick a Confidence Level
Almost everyone chooses 95%. If you choose less than that, people may look at you funny or like you have something to hide! Of course there may be appropriate uses for confidence levels less than 95% but it’s not common. If you’re testing something super important, like the safety of airplane parts, you want a confidence level much higher than 95%! Probably like 99.99999% or more!
In this case, we’ll stick with 95%.
Step 4: Null and Alternative Hypotheses
As always with hypothesis testing, we need to specify null and alternative hypotheses. In statistics, we’re never talking about an exact match – it will almost never be that way. See Barbara’s Kakes+ example for more on this. In this case, our hypotheses would be:
Null Hypothesis
pA – pB = 0
That there is no difference between the two pages – that is, statistically, one does not result in more donations than the other. If you subtract two numbers that are equal, you would get 0, which is why the hypothesis is written this way. These are all appropriate ways of stating the null hypothesis in words:
Alternative Hypothesis
You have three options for the alternative hypothesis: pA – pB > 0, pA – pB < 0, or pA – pB ≠ 0. In this case, we’ll choose pA – pB > 0 because we think that page A is performing better than page B, and subtracting a smaller number from a larger number results in a positive answer.
Step 5: Meeting Assumptions
The assumptions associated with a difference of proportions test are discussed in the last column of this table (taken from the Statistics for Dummies Cheat Sheet):

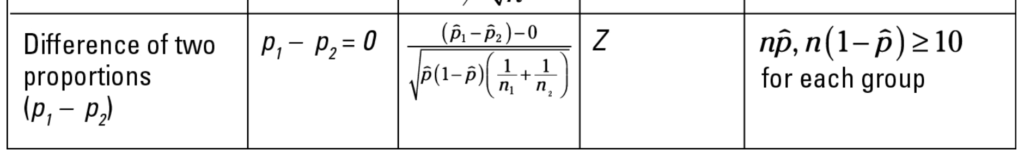
Let’s break down the variables and assumptions into a table:
| Page A | Page B | |
| N | 100,000 | 80,000 |
| P | 20,000/100,000 = .2 | 15,000/80,000 = .1875 |
| Np | 100,000 * .2 = 20,000 | 80,000 * .1875 = 15,000 |
| N(1-p) | 100,000 * (1-.2) = 80,000 | 80,000 * (1-.1875) = 65,000 |
Looks like we met the requirements! Np and n(1-p) are well above 10 for both of these. The reason that they must be above 10 is because statements cannot be made with enough confidence about small samples. You need a large enough sample size to do the test.
Step 6: Find the Pooled p
This is a special calculation we have to do for a difference of proportions hypothesis test. It is essentially finding a weighted average of the two proportions:
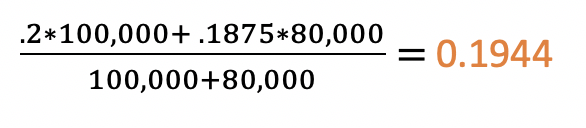
0.1944
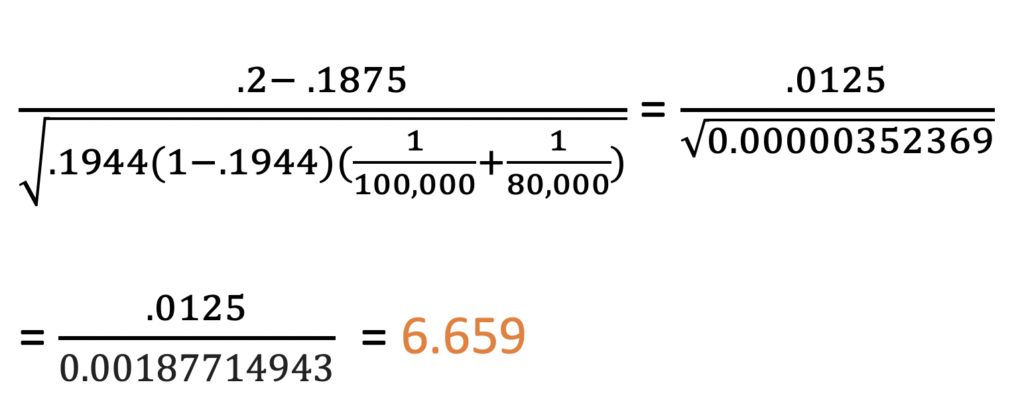
Step 7: Calculate a Z score
We see from the table above that we are using the Z test statistic, and the table also provides the formula. So, we just plug in the numbers!
Step 8: Discuss Results
A Z-Score of 6 is huge! Take a look at the normal distribution:
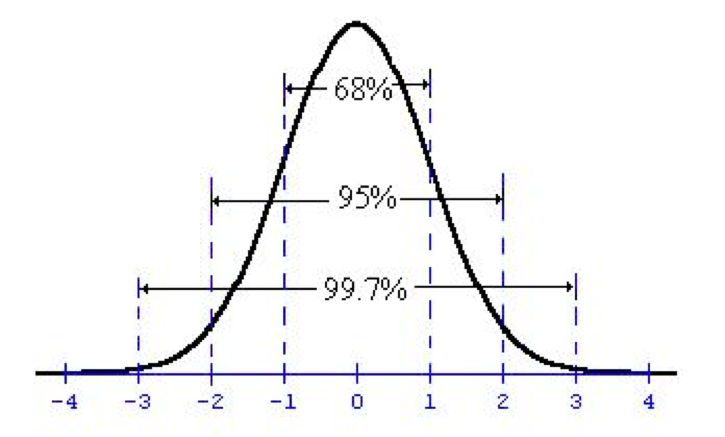
The area underneath the curve (that is, from the curve to the x axis) is the probability of getting a result as large as you did if the null hypothesis is true. To put that in the context of our problem, it means “the probability of getting a difference of .0125 (1.25%) if the difference of the two proportions is actually 0%.” The area between the curve and the x axis at Z = 6 (which is so far to the right it isn’t even on the chart!) is extremely small – less than 1%. We can get the exact value using a p-value calculator.
At 95% confidence, we need the Z score to be above 2 (or equivalently, the p-value to be less than 5%) to reject the null hypothesis. So, since they are, we can at 95% confidence reject the null hypothesis that there is no difference between the two pages in favor of the alternative hypothesis, that page A performs better than page B. These are some other appropriate ways of stating the result:
- At a 95% confidence level, the proportion of viewers who donate after viewing page A is statistically significantly greater than the proportion of viewers who donate after viewing page B.
- With 95% confidence, we can state that page A performs better than page B in number of donations solicited
- At 95% confidence, page A has a statistically significant higher proportion of donors than page B.
Notice that all of these contain “at 95% confidence” or “with 95% confidence,” etc. Language like this is important in statistics! If we had chosen another confidence level, our result may be completely different.
<< Previous Post
"Population Mean Hypothesis Test Example"
Next Post >>
"Useful Python Snippets"